
The core problem with AI sales ROI in home services is not the tools. It is the missing number to measure them against. U.S. heating and air-conditioning contractors generated $158.4 billion across 118,433 businesses in 2025, according to IBISWorld, a market large enough that even a small efficiency gain multiplies quickly across calls and jobs. That scale is exactly why vendor ROI claims sound plausible and still prove nothing.
Without a baseline, any rise in booked calls or revenue is credited to the AI, even when the real cause is a heat wave, a new ad campaign, or the ordinary fact that some months book better than others. Home services makes this harder than typical software ROI math. Demand swings sharply by season, and operational data is scattered: in Simpro's 2025 Trades Outlook, 98% of trade businesses called data centralization a priority, yet a third had no clear plan to achieve it. And according to ServiceTitan's 2026 Residential State of the Trades report, only about 25% of residential contractors use AI at all, so you likely have no "before AI" record to compare against.
Here is how we approach it, in order: the KPIs that actually track AI's contribution, how to pull a clean baseline before a tool goes live, how to separate the tool's effect from everything else moving the business, a worked calculation for a mid-size HVAC company, and the measurement mistakes that most often distort the result. Each step depends on the one before it. Skip the baseline and your KPIs are just noise. Skip the attribution step and the ROI figure is an estimate with nothing behind it.
Our 14-Day AI Audit is built on this baseline-first approach: a structured review of your last 90 days of jobs, calls, and invoices that produces a customized roadmap and ROI projection before you spend a dollar on implementation. Whatever process you use, the sequence below is the one that holds up.
The six KPIs that actually measure AI sales performance in home services
Forget the generic SaaS payback metrics borrowed from a software company's investor deck. They don't fit a trade business like yours. The six numbers below are field service numbers, and each one maps to a specific category of AI sales tool doing a specific job.
Booked call rate. This is the share of inbound calls that turn into a booked appointment. ServiceTitan figures compiled by HVAC Know It All put the booking rate for untrained call staff near 42%, against roughly 90% for trained staff, and estimate that a five-point improvement adds about $100,000 in annual revenue for the average residential shop. The inverse number matters more for AI evaluation: missed calls. The same compilation cites Invoca data showing 35% to 50% of inbound calls to HVAC companies go unanswered, and ServiceTitan data showing 35% to 45% of service calls arrive after the office has closed, which is precisely where an AI answering tool does its heaviest lifting. Segment this number by time of day and by individual call taker. Otherwise you cannot tell whether the lift came from the AI or from a new hire on the phones.
Lead response time, often called speed-to-lead. The widely cited MIT lead response research found that leads contacted within five minutes are 21 times more likely to qualify than leads contacted at thirty minutes. Home service teams rarely hit that window: Hatch's analysis of 132,188 speed-to-lead campaigns found that 88% of users take longer than five minutes to reply. LeadConnect's 2024 data, cited by Mediagistic, found that 78% of leads go to whoever responds first. Hold any AI-driven channel to a benchmark of under 60 seconds. In an industry where job values run from a service call of a few hundred dollars to a five-figure installation, that speed advantage shows up directly in booked revenue.
Quote conversion rate, or estimate close rate. Close rates vary widely by trade, job type and season, which is exactly why a company's own baseline matters more than any published average. AI-driven estimating tools move this number through good-better-best pricing tiers and digital proposals that include financing options. Track the rate separately by job type: service call, repair, install. The mix shifts season to season, and combining them hides exactly where the tool is or is not working.
Average ticket size. A single company-wide average tells you very little, because job values span a wide range. Housecall Pro's 2026 HVAC pricing guide puts typical service calls at $70 to $200, repairs at $150 to $2,500, and system installations at $5,000 to $12,500. Segment by service call, repair, install, and maintenance agreement, and the picture of where AI pricing tools actually change behavior becomes much sharper.
Cost per booked job (CPBJ). The formula is simple: total marketing spend plus AI tool spend, divided by the number of booked jobs. It is the most financially direct KPI on the list, because it puts lead generation cost and AI tool cost into the same unit of value. LocaliQ's 2025 benchmarks put the average cost per lead for home services search advertising at $90.92, but cost per lead alone says little. Pair it with booked rate and close rate by source and the real figure, CPBJ, comes into focus. SearchLight's January 2026 benchmark, drawn from 816 contractors, found a 37.6% book rate for non-branded search leads, meaning you need roughly three such leads to book one job. Compressing that ratio is the actual job the AI tool has to do.
Follow-up recovery rate, or unbooked estimate reactivation. This is the share of previously unbooked estimates that close after a follow-up sequence. Many home service companies send an estimate and then wait for the customer to call back, so a large pool of qualified, already-quoted work goes cold. Automated follow-up by text, call and email is one of the most common AI sales deployments for exactly that reason. Of every KPI on this list, this one has the cleanest attribution path: the only thing separating the original unbooked estimate from the eventual closed job is the follow-up itself.
Skip the vanity numbers: total call volume, total estimates sent. Every KPI above ties to a specific AI function and a specific dollar outcome, and anything that doesn't clear that bar is just noise that wastes the time of whoever reports on it every month.
Extracting baseline figures from call logs, job records, and invoices before any tool goes live
Reconstruct historical performance before implementation starts, not after. Doing it retroactively invites guesswork and bias into numbers that are supposed to be neutral, and once you have seen the "after" number, the "before" number tends to get remembered a little worse than it actually was. That's not dishonesty. It's just how memory works under pressure to show a win.
Pull 90 days of history at minimum, ideally spanning a full seasonal cycle. Shorter windows risk mistaking a slow week for a trend.
For booked call rate, pull inbound calls against booked jobs from the same session, sourced from ServiceTitan, Housecall Pro, Jobber, or whatever field service management platform you use. Segment by after-hours versus business hours, and by individual CSR. Those sub-baselines are what let you later isolate where an AI answering tool actually changed the outcome, rather than crediting it for a good CSR's normal performance.
Lead response time baselines come from the gap between the timestamp when a lead arrives and the first logged contact attempt. This is harder than it sounds. Job details, quotes and call records often live in separate systems, so manual cross-referencing between call logs and CRM records is frequently the only option. Segment by lead source (phone, web form, local service ads), since different AI tools target different channels.
Quote conversion baselines come from matching estimate records against invoiced jobs within a reasonable close window, typically 30 days for service work and up to 60 for installs. Segment by job type. Mixing service calls with installs muddies exactly where an AI estimating tool is or isn't moving the needle.
Average ticket baselines come from an invoice export by job type, segmented by season. A deployment timed for summer has to compare against last summer, not last spring, since HVAC tickets spike in both summer and winter for reasons that have nothing to do with software. Flag membership and maintenance agreement jobs separately too. Bundled revenue distorts the average in ways that are easy to miss.
Cost per booked job baselines combine ad platform exports (Google Ads, local service ads) with CRM booked-job counts tagged by lead source. The AI tool's cost becomes a new line item in the denominator after deployment, and the pre-deployment CPBJ is the clean number to hold it against.
Follow-up recovery baselines come from pulling every estimate marked unsold or no-response over the prior six to twelve months, then checking how many eventually converted with no systematic follow-up in place. Most businesses find this number sits close to zero, which makes the baseline easy to establish and any post-deployment lift easy to credit honestly. Each of those unbooked estimates also carries the marketing cost already spent to generate the lead, which is why recovering even a small share of them tends to pay back quickly.
Our 14-Day AI Audit is built around exactly this data pull: a 90-day review of your jobs, calls, and invoices that produces these baselines before any implementation dollar gets spent. Once the baseline is set, phase the targets into a 90-day goal, a four-to-six-month goal, and an annual goal, all built from your own numbers rather than a vendor's promise.
Separating the AI tool's impact from seasonality, marketing changes, and other variables
Demand swings hard by season. Summer no-cool emergencies and winter no-heat calls inflate booked call rate and average ticket regardless of whatever tool runs in the background. Crediting every improvement to the AI is the single most common mistake in this kind of measurement, and it's an easy mistake to make, because the numbers really do go up. That doesn't mean the tool did it, and treating correlation as proof here is where most ROI claims fall apart.
Year-over-year same-period comparison is the minimum viable method if you run a smaller operation. Compare booked call rate in July after deployment against July before deployment, holding ad spend constant in the comparison. Check lead volume in the same window too: if marketing spend rose 20% and booked jobs rose 20%, the AI tool may have contributed nothing at all to that lift. The limitation here is real, since weather and macro demand shift year to year regardless of anyone's marketing budget, so this method works best paired with the ones below rather than used alone.
Holdout groups give cleaner data. Permanently route a small slice of calls or leads away from the AI-driven process, keeping a live control group running the old way. There's a real cost to this, since the holdout group forgoes whatever efficiency gain the rest of the business is capturing, but the attribution data that comes out the other side is about as clean as this measurement gets. In practice, that might mean routing after-hours calls from one zip code to voicemail, the old process, while every other zip code goes to the AI answering tool, then comparing booked rates between the two groups over time.
Incremental lift measurement means narrowing the lens to exactly where the tool operates. If the AI only handles after-hours calls, measure booked call rate for the after-hours window specifically, not total call volume across the whole day. If it only handles estimate follow-up, measure follow-up recovery rate, not overall close rate, which technician performance and pricing also swing. Broad revenue comparisons blur causality. Narrow ones don't, which is the whole argument for using them.
If you have enough data volume, you can use marketing mix models. These models weigh every marketing input against external factors such as seasonality and weather at the same time; for an HVAC company, that means separating how a heat wave moved AC repair volume from anything the AI tool did.
Before trusting any post-AI number, run through a short checklist. Did ad spend change in the measurement window? Did pricing change? Was there an unusual weather event, did you add or lose CSRs, was there a promotional push running at the same time? Any one of these can move a KPI on its own, and skipping this checklist leaves you with a number that flatters the tool instead of describing it.
A worked ROI calculation for a mid-size HVAC company
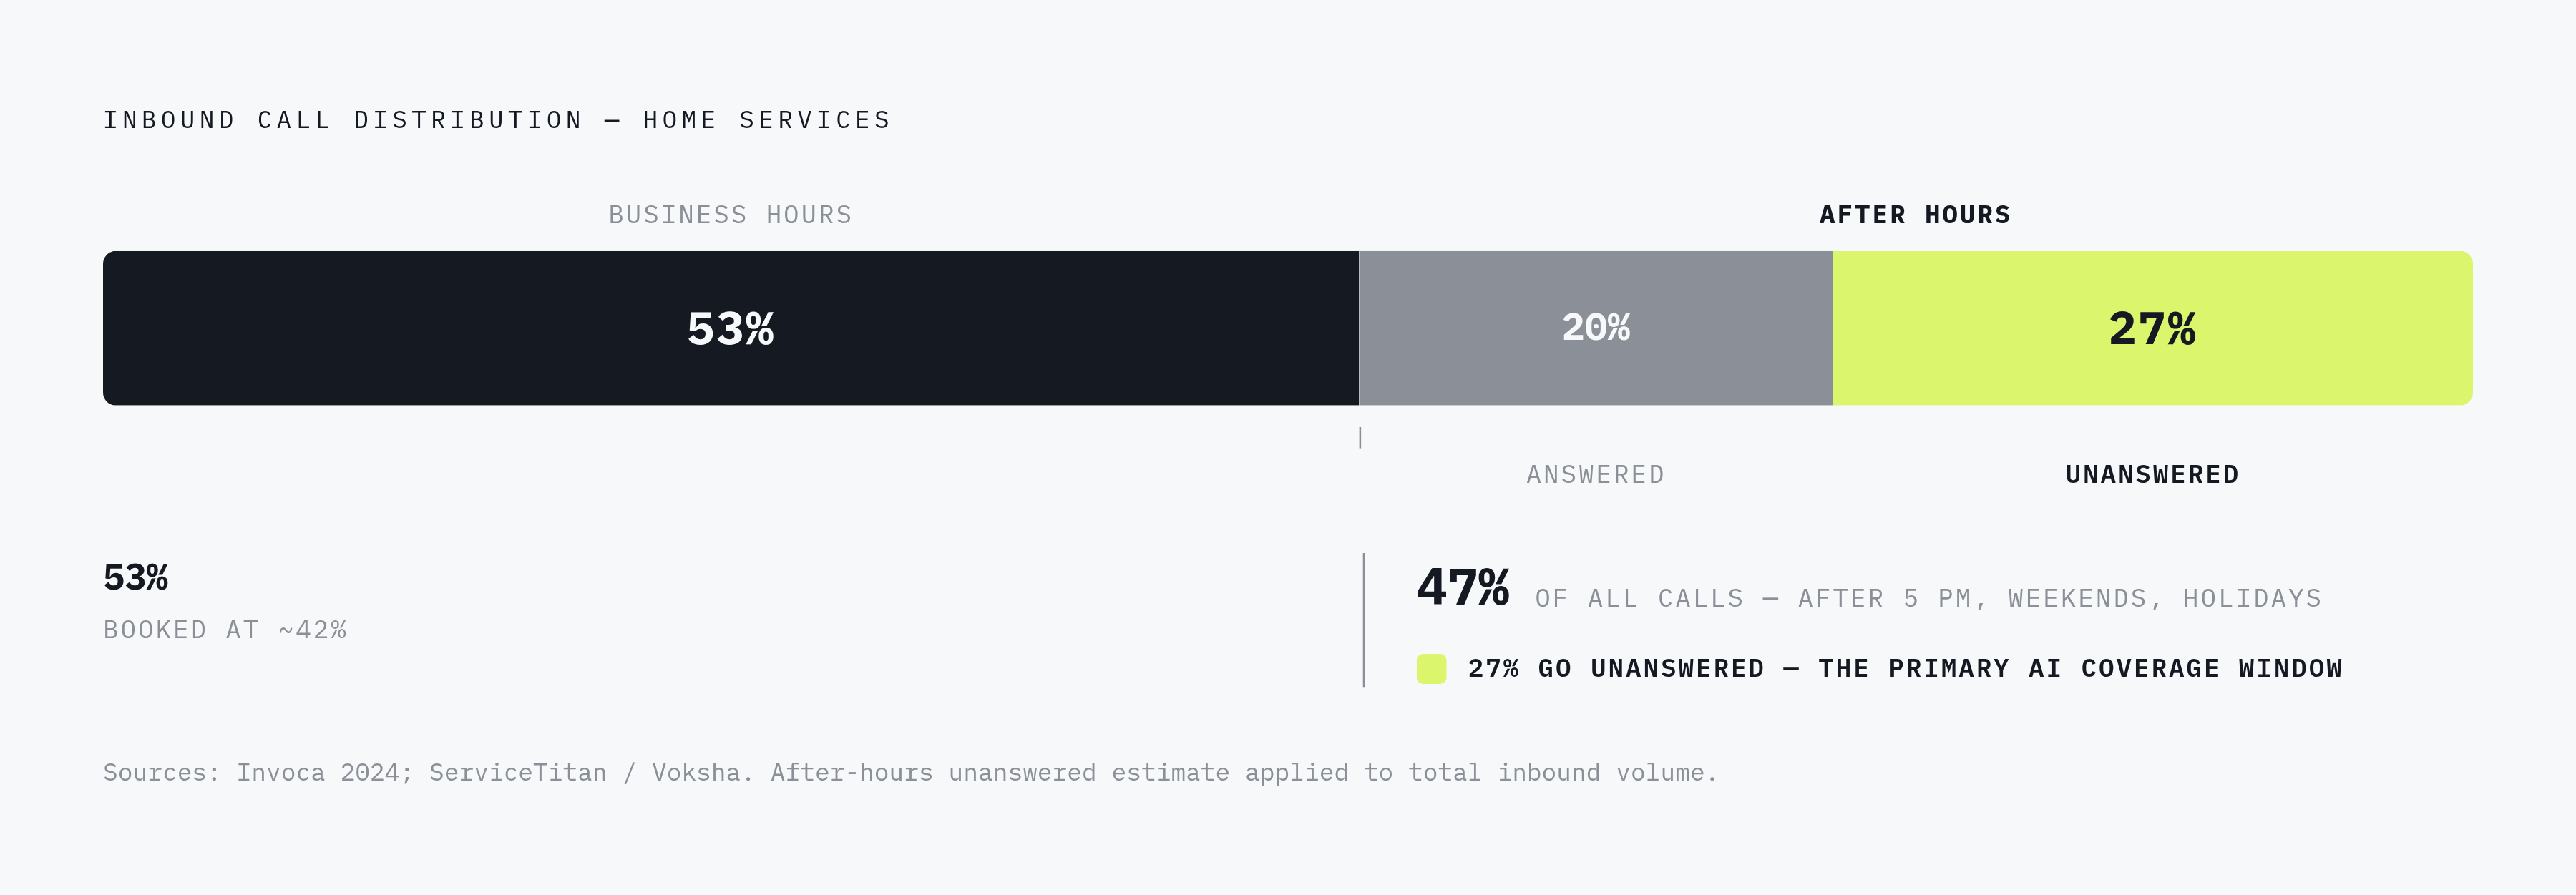
Take a residential HVAC company with 8 to 12 technicians, fielding about 300 inbound calls a month in a market with ordinary seasonal swings. The figures below are illustrative assumptions chosen to show the method, not results from a specific company; a real calculation would use the baselines pulled in the previous section.
The baseline, pulled from 90 days of call logs and invoices before any deployment, looks like this. About 35% of calls, roughly 105 a month, arrive after hours, the low end of the 35% to 45% range cited above. Many of those reach voicemail, and the after-hours booked call rate sits at 20%, or about 21 booked jobs a month. The average revenue on an after-hours booked job, mostly repairs, is $450, with a gross margin of 50%.
The intervention here is a 24/7 AI call answering system, deployed specifically for the after-hours window rather than replacing daytime staff. That narrow scope is what makes the attribution clean: the tool only touches calls that come in after hours, so any change in the after-hours booked call rate belongs to the tool, following the incremental lift method above, rather than getting folded into a company-wide number that includes daytime CSR performance.
Now run the numbers. Suppose that after 90 days the after-hours booked call rate has risen to 35%, measured in the after-hours window only, with ad spend, pricing and staffing unchanged and the same months of the prior year showing no similar rise. That is 15 additional percentage points on 105 calls, or about 16 additional booked jobs a month. At $450 each, that is $7,200 in added monthly revenue and $3,600 in added gross profit. Against an assumed tool cost of $500 a month, the net gain is $3,100 a month, a return of a little over six times the tool's cost.
Then test how sensitive that result is. If the lift is only 5 points instead of 15, the tool adds about 5 booked jobs, $2,250 in revenue and $1,125 in gross profit, for a net gain of $625 a month: still positive, but a very different decision about how much more to invest. That range is the point of building the baseline first. Without it, the ROI conversation is a debate about whether the tool feels like it is working. With it, the conversation is a comparison between two numbers you already own, for the one part of the business the tool actually touches.
Common measurement mistakes
Crediting seasonal demand to the tool. A deployment that goes live in June will look successful in July whether or not it works. Compare like-for-like periods.
Measuring the whole business instead of the workflow the tool touches. Company-wide revenue hides the effect of a tool that only answers after-hours calls or only follows up on estimates.
Leaving the tool's cost out of cost per booked job. The subscription, setup and staff time belong in the calculation once the tool is live.
Using vendor benchmarks as the baseline. Industry averages are useful context, but the only baseline that proves anything is your own historical data.
Changing several things at once. Launching an AI tool in the same month as a new ad campaign or a price increase makes clean attribution impossible.
Tracking activity instead of outcomes. More calls handled or more estimates sent is not a return. Booked jobs, closed revenue and cost per booked job are.
Where to start
Measuring AI sales ROI does not require sophisticated software. It requires a baseline taken before anything changes, a short list of KPIs tied to specific tools, and the discipline to separate the tool's effect from everything else moving the business. If you do that work first, you will make better buying decisions, because you will know which number each tool has to move and what moving it is worth.
If you would rather not assemble those baselines yourself, our 14-Day AI Audit reviews your last 90 days of jobs, calls and invoices and returns every automation candidate ranked by payback, before you commit to any tool.